Analyzing Data
The guiding question of this lecture is Are the winters in Chicago becoming milder?
We reformulate this question with three other questions:
Is there data to address this question?
How to acquire, store, and represent the data?
Does the original question become a mathematical one?
Gathering, Storing, and Plotting Data
The National Oceanic and Atmospheric Administration (NOAA) has a site <https://www.weather.gov> (The National Weather Service):
Navigate to Past Weather.
Enter
Chicago, ILas the location.Click on the work
Chicagoon the map at <https://www.weather.gov/wrh/climate>.Make the selections to request data.
The screen shot is shown in Fig. 6. At <https://www.weather.gov/wrh/climate?wfo=lot> is the location for the web interface to the data.
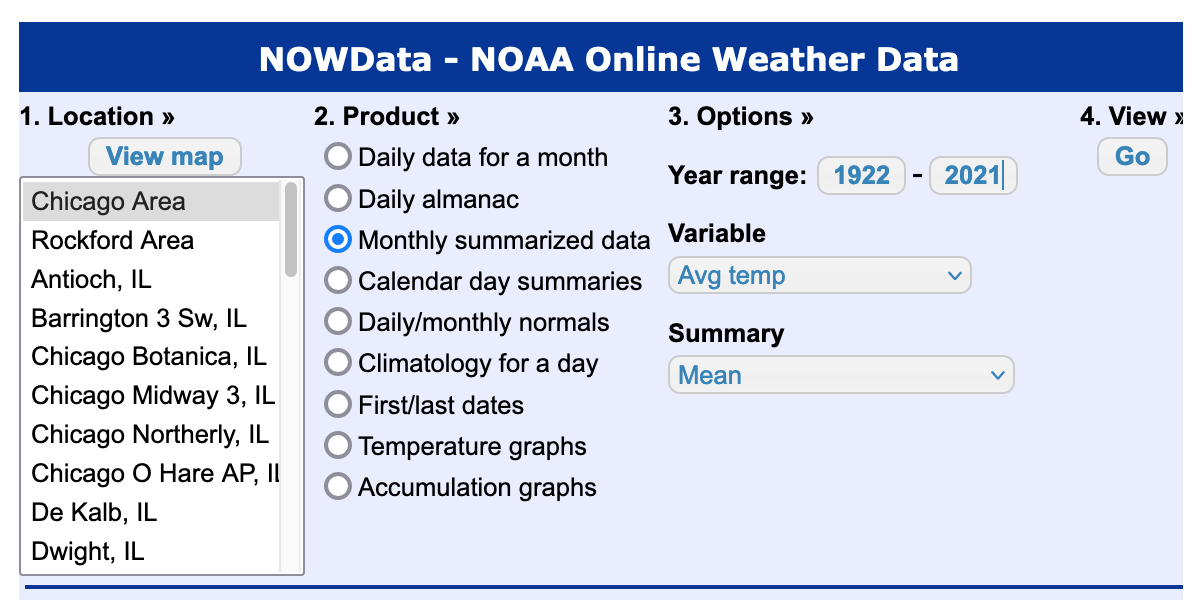
Fig. 6 Selecting the mean temperatures when downloading data.
To process the data, we need to retrieve the data in a text format. No plain text file is directly available to download … There is a hack:
Copy and paste the numerical data.
Make a header line separately and pasted in.
The file
tempChicago100years.txtstores the data.
Copy and paste is not ideal, but still better than manual data entry.
The lecture continues with the average temperatures. Another question related to the original question is Are the winters in Chicago becoming more extreme? To address this question, the first exercise asks to download the minimum and maximum monthly recorded temperaturs.
The processing of the data in the file
tempChicago100years.txt in an interactive Julia session is below,
edited for brevity.
julia> using DelimitedFiles

julia> A = readdlm("tempChicago100years.txt")
101×14 Matrix{Any}:
     "Year"    "Jan"    "Feb"    "Mar"  ..   "Dec"
 1922        24.8     29.4     39.3           29.9
 1923        30.7     22.3     33.0           39.7
   .
   .
 2019        21.0     25.9     34.3           34.0
 2020        30.1     30.2     42.8           32.8
 2021        29.2     20.2     44.2     ..    38.0

julia>
Observe the following:
The numbers on file were separated by spaces (not commas).
The type
Anywas caused by the header (strings).
The session to process the data continues next.
julia> using Statistics

julia> A[1,13]
"Dec"

julia> dec = A[2:end,13];

julia> mean(dec[1:50])
29.223999999999997

julia> mean(dec[51:end])
28.671999999999997

julia> mean(dec[1:10])
30.04

julia> mean(dec[91:end])
32.06
A basic plot of the December temperatures is shown in Fig. 7. Just by looking at the numbers:
julia> dec[60:69]
10-element Vector{Any}:
 24.9
 35.9
 14.3
 31.0
 17.0
 30.6
 32.1
 27.7
 17.4
 28.6
we observe that the eighties had some very cold December months.
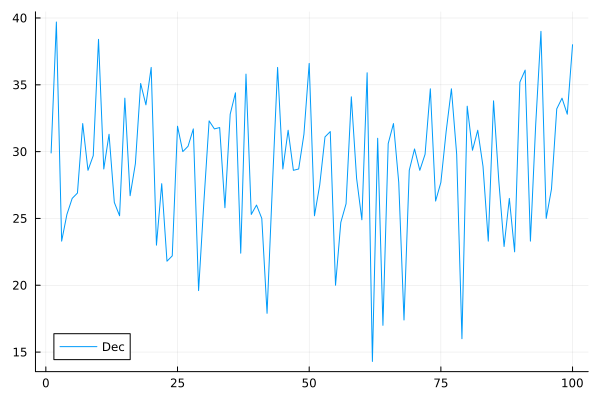
Fig. 7 The mean temperatures of the last 100 December months.
The plot of the averages of the last 100 winter months (December, January, February, and March) is in Fig. 7.
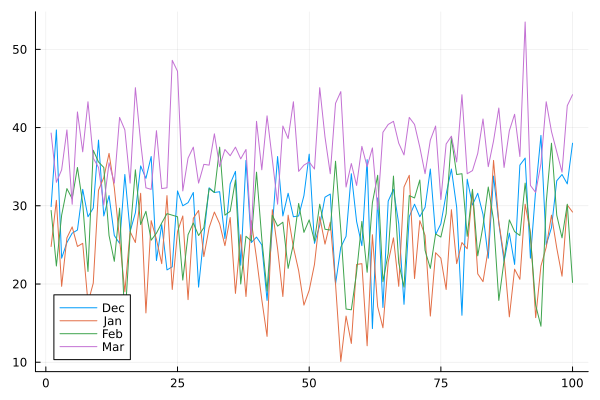
Fig. 8 The mean temperatures of the last 100 winter months.
Data Frames: Spreadsheets for Programmers
Data structures are organized by dimension:
A Series is a one dimensional labeled array, capable of storing data of any type. The axis labels are called the index.
A DataFrame is a table with rows and columns.
columns may be of different type,
the size is mutable,
axes are labeled,
arithmetic can be performed on the data.
A Panel is a 3d container of data.
The name pandas is derived from Panel Data, as pan(el)-da(ta)-s.
The package DataFrames.jl is the Julia analogue to Pandas.
Turning a text file with data into a data frame goes quickly:
julia> using DelimitedFiles

julia> A = readdlm("tempChicago100years.txt");

julia> using DataFrames

julia> df = DataFrame()

julia> df.Year = A[2:end,1]

julia> df.Dec = A[2:end,13]
This makes a DataFrame with the December temperatures. What are the coolest and warmest Decembers? Well, sort the data:
julia> sort(df, :Dec)
100x2 DataFrame
 Row | Year  Dec
     | Any   Any
-----+------------
   1 | 1983  14.3
   2 | 2000  16.0
   3 | 1985  17.0
   4 | 1989  17.4
   5 | 1963  17.9

  96 | 1971  36.6
  97 | 2021  38.0
  98 | 1931  38.4
  99 | 2015  39.0
 100 | 1923  39.7
Even in the shortened output, we recognize the cool December months in the eighties and the more recent warm temperatures in December.
More Topics for the first Project
The three additional topics are data oriented.
The Winters in Chicago
January 2023 appeared to be one of the warmest winter months, at least in Chicago, IL.
Download data for the first winter month, starting December 21 to January 20, for the past 100 years. Look for minima, maxima, and average temperatures for each day.
Analyze the data with plots and segmentation, that is: divide the 100 years up in decades.
Earthquake Data
Which regions in the United States are most vulnerable to earth quakes?
Visit <https://earthquake.usgs.gov> and download data.
Focus on three attributes
location,
time range, and
magnitude.
Make sure that for each location, the same time range and magnitudes are selected.
Analyze the data with plots and statistics. The software
Cartopy(in Python, or through Julia) may be useful, but not necessary.
Displaying Geographical Data
Many data sets are geographical, e.g.: weather, earth quakes. In this computational project, explore the software
Cartopy.Summarize the features of
Cartopy.Demonstrate the use of
Cartopyon actual data.
Exercises
Download the minimum and maximum monthly recorded temperatures in Chicago for the past one hundred years.
Compare the mean temperatures of the ten decades in the past 100 years for the four winter months.
For the minimum and maximum temperatures downloaded in Exercise 1:
Compare the means of the minimum and maximum of the ten decades in the past 100 years for the four winter months.
Also compare the corresponding standard deviations.
For the minimum and maximum temperatures downloaded in Exercise 1:
Make a plot for the minimum and maximum temperatures for the four winter months for the past 100 years.
Make a plot for the difference between the maximum and the minimum temperatures for the same time ranges.
Did the months with the minimum and maximum temperatures occur in the months with the smallest and largest means?
For the data downloaded in Exercise 1, make a DataFrame with the minimum and maximum temperatures for each December in the past 100 years.
Sort the columns and compare with the means.
Bibliography
Wes McKinney: Python for Data Analysis, O’Reilly 2013.
Jose Storopoli, Rik Huijzer, Lazaro Alonso: Julia Data Science. First edition published 2021. <https://juliadatascience.io>