| http://www2.math.uic.edu/~jlewis/math165/asavgcost.pdf |
| It is asserted that if you drive a car at constant speed; the number of miles per gallon will first increase and then decrease (or a reasonable range say 15 mph to 90 mph). Can someone explain the physics of this? Is there any sense that this function is quadratic? |
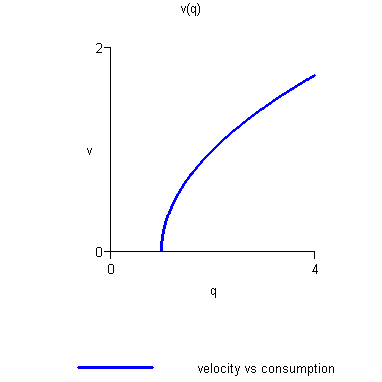
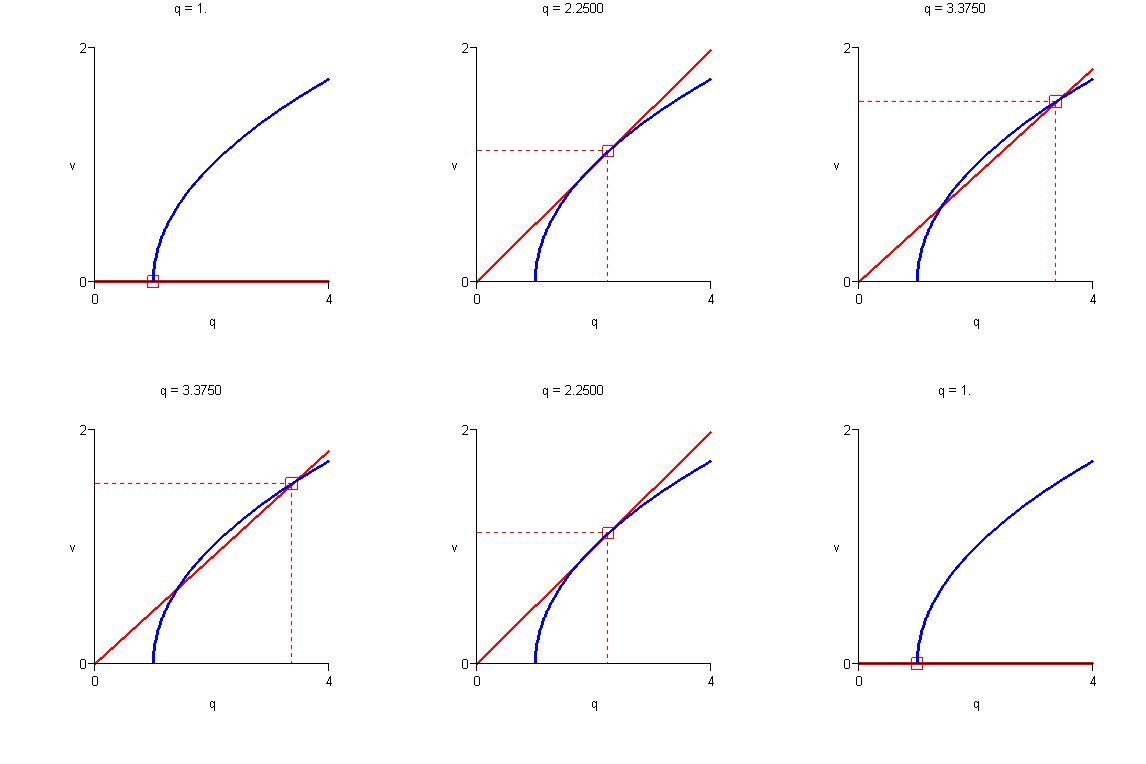
Criterion for Maximum Fuel Mileage. Fuel efficiency is maximized when
|
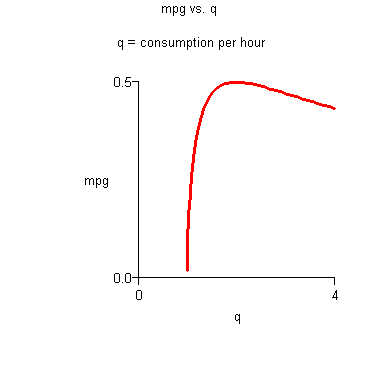
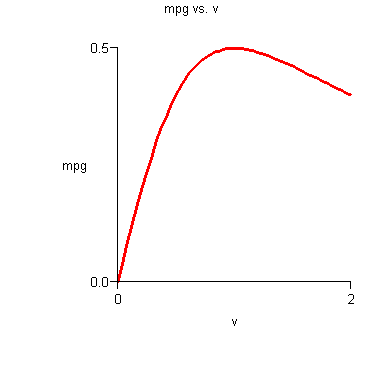
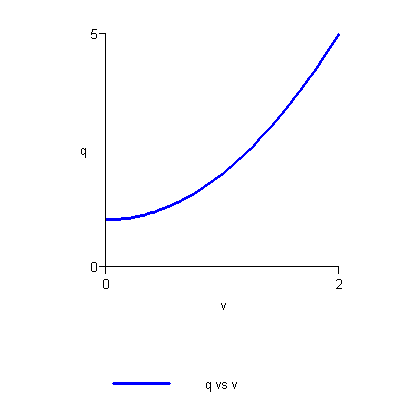
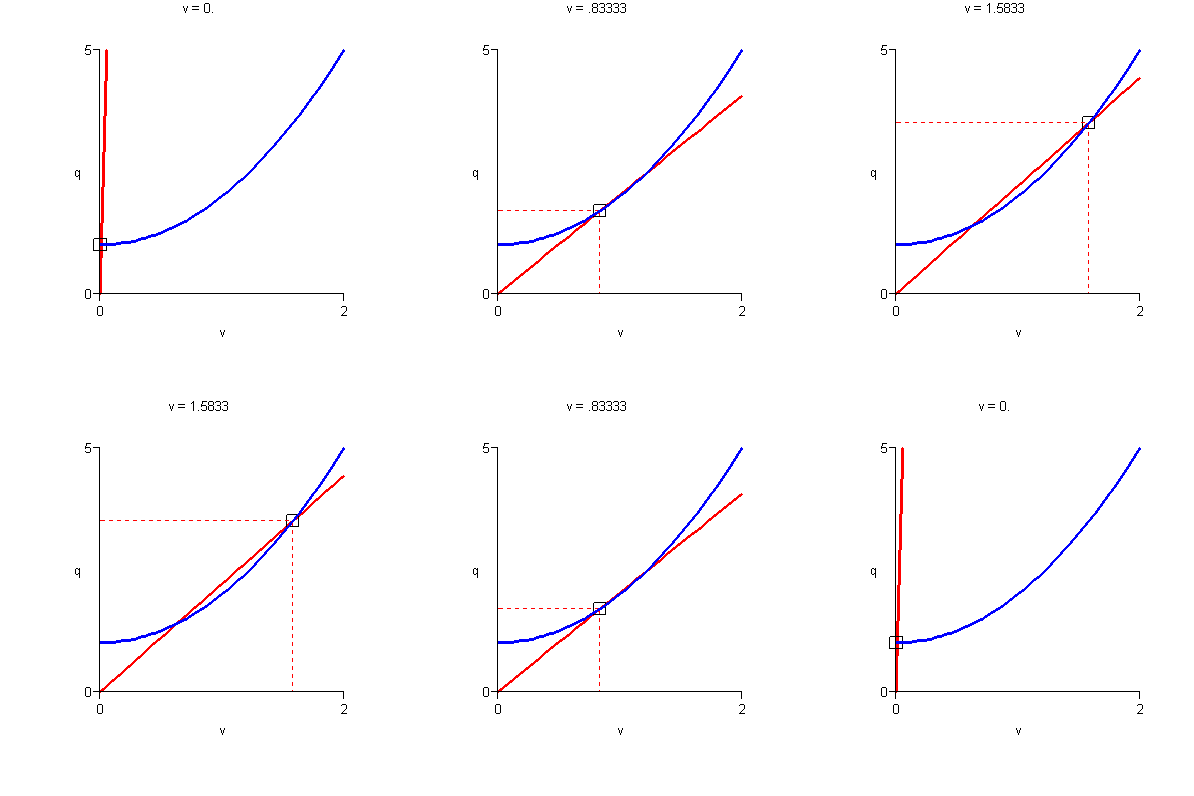
Criterion for Maximum Fuel Mileage. Fuel efficiency is maximized when (q/v) = dq/dv (or v/q = dv/dq). The plot of fuel efficiency is the graph of the function v/q(v).

- 1.
- Mathematical Assumption - Concavity This note was motivated by a lively discussion in the Department about the physics of the nature of the nonlinearity in the dependence of mpg on velocity. The key assumption is that the rate of fuel consumption, q(v) is a nonnegative, increasing, concave upward function of the velocity, v.
| http://www2.math.uic.edu/~jlewis/math165/asfuel.pdf |
- 2.
- Microeconomics - Elasticity. Since the author (Jeff Lewis) is currently teaching Calculus for Business, we were reminded of a similar problem on Cost-Benefit Analysis in microeconomics.
Marginal Analysis Criterion for Minimal Average Cost. Average cost is minimized at the level of production where average cost equals marginal cost; that is A(q) = C¢(q). We showed
Criterion for Maximum Fuel Mileage. Fuel efficiency is maximized when (q/v) = dq/dv (or v/q = dv/dq). There is room for exploration. If we interpret the Criterion for Maximum Fuel Mileage in noncalculus terms - replacing (dv/v) and (dq/q) by small percentage changes in v and q, the economic principle seems to be that fuel efficiency is optimized when small percentage changes in v produce approximately equal percentage changes in q. Another characterization is that the v elasticity of q is 1 . See
| http://www2.math.uic.edu/~jlewis/math165/math165avgcost.htm |
Footnotes:
1This note was motivated by a lively discussion in the Department about the physics of the nature of the nonlinearity in the dependence of mpg on velocity. The "physics" assumed is that the functions which describe consumption, q, in terms of velocity, v, are positive, increasing, and concave upward. 2The graph is concave down if "at higher speeds equal changes in consumption will give smaller increases in speed." 3See the discussion Notes on the Approach at the end of the note. 4The graph is concave up if "at higher speeds equal changes in velocity require larger increases in consumption."File translated from TEX by TTH, version 3.79.
On 02 Mar 2008, 21:18.