Cluster Analysis
One goal of data mining is to discover patterns. Another is to correlate data. For example, could there be a link between homework grades and exam performance?
Random Clustered Data
Before we look at actual data, we will first generate our own data, using random number generators. The data we generate will be arranged in clusters. Each cluster is determined by 3 parameters:
- the centroid is given by coordinates \((x,y)\),
- the number \(n\) of points in the cluster,
- the radius is the largest distance of any point in the cluster to the centroid.
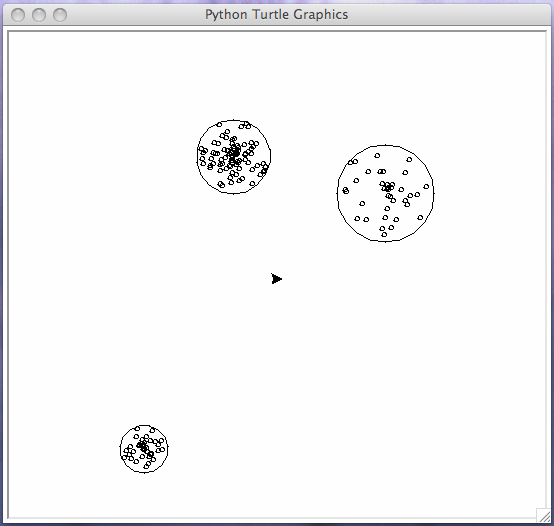
Fig. 7 Three typical, randomly generated clusters.
The script makedata.py will
- prompt the user for the number of clusters, either then typical clusters are generated, or for each cluster, the user is prompted for centroid, number of points, and radius;
- visualize the data via turtle graphics;
- prompt the user for a file name to save the data.
The function cluster belows generates random points.
from random import random
from math import cos, sin, pi, sqrt

def cluster(nbr, ctr, rad):
    """
    Returns a list of nbr points with
    integer coordinates, in a disk with
    center ctr and radius rad.
    We use the polar representation of the points.
    """
    points = []
    points.append(ctr)
    for _ in range(1, nbr):
        rpt = rad*random()  # radius of the point
        apt = 2*pi*random() # angle of the point
        xpt = ctr[0] + round(rpt*cos(apt))
        ypt = ctr[1] + round(rpt*sin(apt))
        points.append((xpt, ypt))
    return points
We generate typical data with the following function.
from random import randint

def typical_data():
    """
    Generates random numbers for (nbr, ctr, rad).
    """
    data = []
    ndc = int(input("Give the number of clusters : "))
    for i in range(ndc):
        nbr = randint(10, 100)
        ctr = (randint(-200, 200), randint(-200, 200))
        rad = randint(10, 50)
        data.append(cluster(nbr, ctr, rad))
    return data
To visualize the data, we need to compute
for each cluster:
the centroid for each list; and
the largest distance of each point
in the list to the centroid.
The script makedata.py provides functions
to compute centroids and radii, for use in the
implementation of the K-means algorithm.
The last two lines of the script makedata.py:
if __name__ == "__main__":
    main()
allow to use the script makedata.py as a module.
With a list comprehension, we can give a one line definition
of the function centroids.
def centroids(data):
    """
    Given in data a list of lists of points,
    returns the list of centroids.
    """
    return [centroid(points) for points in data]
The specification for the centroid is below:
def centroid(points):
    """
    Given a list points of tuples (x, y),
    returns the centroid of the points.
    """
Simple Turtle Graphics
For our visualization, we use turtle,
a builtin module in Python,
which is simple to use.
The turtle commands we will use are in Table 4.
| turtle command | what the command does |
|---|---|
import turtle |
import the module |
turtle.tracer(False) |
for faster drawing |
turtle.up() |
put the pen up |
turtle.down() |
put the pen down |
turtle.goto(x,y) |
goto position (x,y) |
turtle.circle(r) |
draws a circle of radius r |
turtle.color(p,f) |
sets pen p and fill color f |
The visualization of the data points with turtle is defined by the following function.
def show_data(data):
    """
    For each point in data, draws
    a circle of radius 2 pixels,
    centered at the data point.
    """
    tracer(False)
    for points in data:
        for pnt in points:
            turtle.up()
            turtle.goto(pnt[0], pnt[1]-2)
            turtle.down()
            turtle.circle(2)
    turtle.up()
    turtle.goto(0, 0)
The centroids and their radii are visualized by the following function.
def show_centroids(ctr, rad):
    """
    Given on input in ctr a list of
    centroids and in rad the corresponding
    radii, draws the disks.
    """
    for k in range(len(ctr)):
        cpt = ctr[k]
        rd2 = rad[k]+2
        turtle.up()
        turtle.goto(cpt[0], cpt[1]-rd2)
        turtle.down()
        turtle.circle(rd2)
    turtle.up()
We will save the randomly generated data to file.
This data will then be read by the script which does
the cluster analysis.
The saving of the data to file is done by the
function save_to_file below.
def save_to_file(data):
    """
    Prompts the user for a file name
    and writes the data to file.
    """
    name = input("give a file name : ")
    datafile = open(name, 'w')
    datafile.write(str(data))
    datafile.close()
Observe the string conversion with str.
We save the string representations of the data to file.
Reading Data From File
We start a new script kmeans.py
which will do the following:
- prompt the user for a file name,
- read in the data, flatten and shuffle,
- run three iterations of the K-means Algorithm, showing the results with turtle.
To make our script user friendly, we have to be careful about the user input. The user may give a name which does not correspond to the right file, or the file may contain wrong data. With the exception handling mechanisms we can handle those errors.
We read files typically line after line, with a repeat - until loop, shown in Fig. 8.
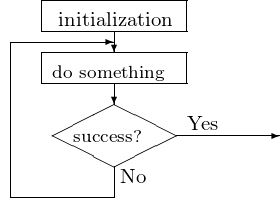
Fig. 8 Flowchart of a repeat - until loop.
The pseudo code for a repeat - until loop is below:
repeat
   try to open a file with given name
until success
This can be coded in Python as
while True:
    try:
        file = open(name, 'r')
    except:
        print "please try again ..."
This repeat - until code, with the exception handler in the try - except block, is applied in the function below.
def read_data():
    """
    Prompts the user for a name of a file,
    tries to open the file and to read a list.
    If all goes well, the list is returned.
    """
    data = []
    while True:
        name = input("give a file name : ")
        try:
            datafile = open(name, 'r')
            data = read_list(datafile)
            datafile.close()
            return data
        except IOError:
            print('could not open file ' + name)
            print('please try again')
    return data
The data is stored in a list on file. The function below processes the string read from file and returns the data in the list.
def read_list(file):
    """
    Attempts to read a list from file
    and will return this list.
    Returns the empty list if exceptions occur.
    """
    try:
        line = file.readline()
        data = eval(line)
        if isinstance(data, list):
            return data
        else:
            print(line)
            print("no list on file...")
            return []
    except IOError:
        print("exception occurred during reading...")
        return []
The K-Means Algorithm
The input statement with the problem specification for the k-means algorithm is as follows:
The algorithm proceeds as follows:
\(C :=\) a random selection of \(k\) points of \(L\);
repeat
- for each \(p\) in \(L\): if \(p\) is closest to \(C_i\), then put \(p\) in the i-th cluster;
- recompute the centroids for each of the k clusters;
- show the clusters
until the clusters are stable.
The running of the algorithm is illustrated in a sequence of pictures, starting with the input in Fig. 9 and going through a sequence of three steps, in Fig. 10, Fig. 11, and Fig. 12.
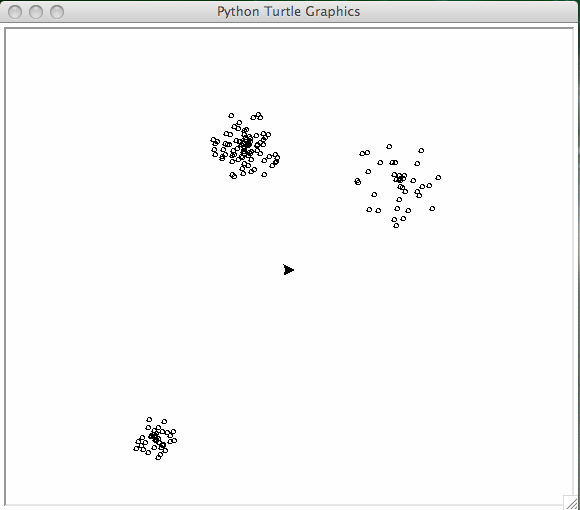
Fig. 9 Input of the k-means algorithm.
Fig. 10 First run of the k-means algorithm, the clusters are shown in red.
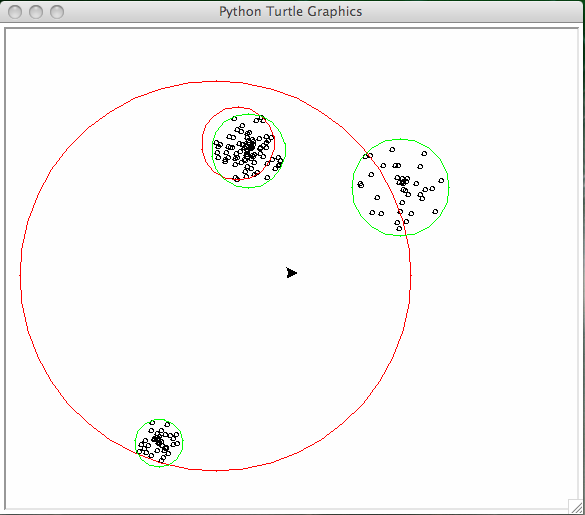
Fig. 11 Second run of the k-means algorithm, the clusters are shown in green.
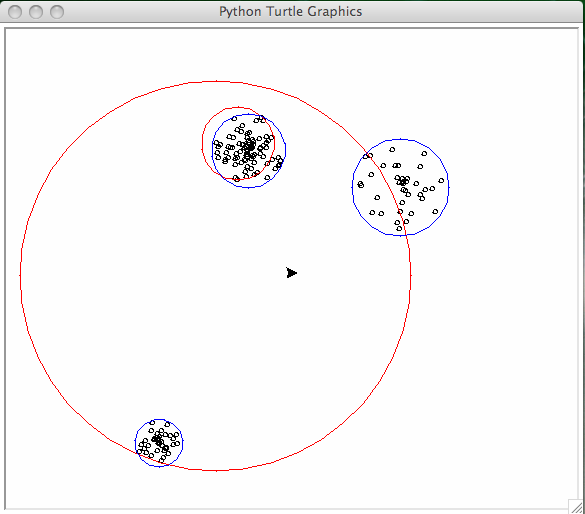
Fig. 12 Third run of the k-means algorithm, the clusters are shown in blue.
List Comprehensions
In the classification of the data we apply list comprehensions.
The function distance(p,q) returns the
Euclidean distance between the points p and q.
def classify_point(ctr, pnt):
    """
    Returns the index of the point q in ctr,
    closest to ctr.
    """
    dis = [distance(pnt, q) for q in ctr]
    minval = min(dis)
    return dis.index(minval)
For any list L and element e,
we have k = L.index(e): L[k] == e.
Now we can formulate the code for the main kmeans function.
To select the first centroids:
random.sample(L,k) returns k unique random
elements from L.
def kmeans(L, k):
    """
    Applies the K-means algorithm 3 times to divide
    the data in L into k clusters.
    """
    C0 = sample(L, k) # k unique random elements from L
    K0 = classify_data(L, k, C0)
    C1 = centroids(K0)
    R1 = radii(K0, C1)
    turtle.color('red', 'red')
    show_centroids(C1, R1)
    input("hit enter to continue ...")
In the second iteration, we classify the points with the newly calculated centroids:
# code for kmeans continued
   K1 = classify_data(L, k, C1)
   C2 = centroids(K1)
   R2 = radii(K1, C2)
   turtle.color('green', 'green')
   show_centroids(C2, R2)
   input("hit enter to continue ...")
Then the third run continues
# code for kmeans continued
   K2 = classify_data(L, k, C2)
   C3 = centroids(K2)
   R3 = radii(K2, C3)
   turtle.color('blue', 'blue')
   show_centroids(C3, R3)
Data From The Web
We can process downloaded data, downloaded onto a file, but we can also read data from the web with a Python script.
The US government collects lots of data. The US Geological Survey provides data sets at <http://earthquake.usgs.gov> about recent earthquakes.
In our application, we are interested in raw data.
We can download comma separated values files
with Python scripts.
With urlopen.request of urllib:
web page \(\sim\) file.
We download a comma separated values (csv) file:
from urllib.request import urlopen

SITE = "http://earthquake.usgs.gov"
URL = SITE + "/earthquakes/feed/v1.0/summary/all_month.csv"

INFILE = urlopen(URL)
OUTFILE = open('quakes.csv', 'w')
while True:
    LINE = INFILE.readline()
    if LINE == b'': # b stands for bytes
        break
    OUTFILE.write(LINE.decode()) # bytes to string
INFILE.close()
OUTFILE.close()
The start of quakes.csv looks like
time,latitude,longitude,depth,mag,magType, ...
2016-01-24T23:48:09.720Z,33.3605,-116.386,11.27,1.04,ml, ...
2016-01-24T22:53:02.000Z,59.3473,-153.1837,100.7,2.4,ml, ...
2016-01-24T22:52:58.460Z,36.6545,-98.4441,12.36,3.1,mb_lg, ...
2016-01-24T22:34:14.280Z,33.5026667,-116.497,13.23,0.98,ml, ...
...
The coordinates of interest are latitude and longitude. The plot of the coordinates of all quakes of magnitude of 5.0 or greater is in Fig. 13.
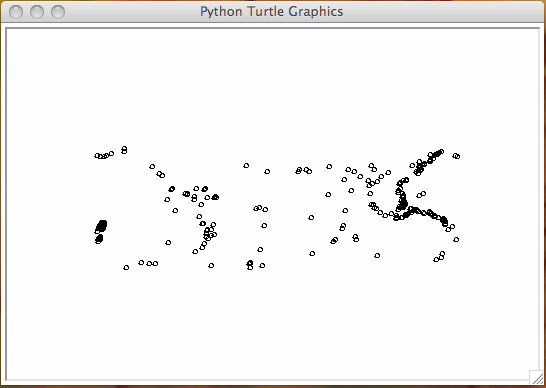
Fig. 13 All earth quakes of magnitude 5.0 or greater.
The script to process the data in the comma separated valued file is below.
from makedata import show_data
DATAFILE = "quakes.csv"

def select_data(mag):
    """
    Opens the file and returns list of
    longitudes and latitudes of quakes of
    magnitude larger than or equal to mag.
    Because latitude runs vertically,
    latitude is y and longitude is x.
    """
    result = []
    file = open(DATAFILE, 'r')
    line = file.readline()
    while True:
        line = file.readline()
        if line == '':
            break
        data = line.split(',')
        try:
            dtm = float(data[4])
        except:
            dtm = 0.0
        if dtm >= mag:
            pnt = (float(data[2]), float(data[1]))
            result.append(pnt)
    return result
For visualization with turtle we round and convert the coordinates to integer values.
Exercises
- Instead of turtle graphics, use a Canvas widget of Tkinter to show the data points.
- One stop criterion for the K-means algorithm is to check whether no points change list after classifying from one iteration to the next. Give Python code of an implementation of the K-means algorithm that uses this stop criterion. You may ignore the visualization part.
- Apply the K-means algorithm to
quakes.csv. Experiment with various numbers of clusters. - With the method
bgpicof turtle we can set the background picture to a world map. Download a"worldmap.gif"file and rescale so the data from quakes.csv is mapped right.